This is an interesting talk:
Math >> Calculating
1. Pose the right questions.
2. Real world problem --> math formulation
3. Computation
4. Math formulation --> real world problem and verification
Maybe not spend so much time on step 3? Use computer programming to nail down understanding! These are very interesting ideas.
===
Thursday, December 30, 2010
Thursday, December 2, 2010
Adding and Subtracting Rational Expressions
To simplify a rational expression:
Step 1: Factor all denominators as a means to easily determine the LCD.
Step 2: Multiply by the appropriate factors to obtain equivalent terms with a common denominator.
Step 3: Add or subtract the numerators and place the result over the common denominator.
Step 4: Simplify the resulting algebraic fraction.
A more involved example follows:
 It is always a good idea to state the restrictions. Remember that the restrictions are the values that produce zero in the denominator.
---
Step 1: Factor all denominators as a means to easily determine the LCD.
Step 2: Multiply by the appropriate factors to obtain equivalent terms with a common denominator.
Step 3: Add or subtract the numerators and place the result over the common denominator.
Step 4: Simplify the resulting algebraic fraction.
A more involved example follows:
---
Mandelbrot Explorer using Flash
Give the below flash movie a minute to download. Move the looking glass over the picture and release it to zoom.
The orbit is displayed, real time, in the corner.
The orbit is displayed, real time, in the corner.
Monday, November 29, 2010
Trigonometric Function Explorer using Flash
Above you should see a flash movie that I have made. This is a test post to see if I could emed a flash component into blogger. The swf file has been saved in Google docs and shared with everyone. Success!
Wednesday, September 15, 2010
Top 100 Most Influential People of the Last Millennium
From the economicexpert.com
On October 10, 1999, the American cable network A&E started counting down a list of the 100 most influential people of the millennium compiled by a staff of 360 journalists, scientists, theologians, historians, and scholars.
As many as 250 people were chosen to be on the list, but only 100 made it, these are the 100 people that did the most to shape the world we live in today.
1 The List
- Johann Gutenberg
- Isaac Newton
- Martin Luther
- Charles Darwin
- William Shakespeare
- Christopher Columbus
- Karl Marx
- Albert Einstein
- Nicolaus Copernicus
- Galileo Galilei
- Leonardo da Vinci
- Sigmund Freud
- Louis Pasteur
- Thomas Edison
- Thomas Jefferson
- Adolf Hitler
- Mahatma Gandhi
- John LockeJ
- Michelangelo
- Adam Smith
- George Washington
- Genghis Khan
- Abraham Lincoln
- St. Thomas Aquinas
- James Watt
- Wolfgang Amadeus Mozart
- Napoleon Bonaparte
- Johann Sebastian Bach
- Henry Ford
- Ludwig van Beethoven
- James Watson & Francis Crick
- René Descartes
- Martin Luther King, Jr.
- Jean-Jacques Rousseau
- Vladimir Lenin
- Alexander Fleming
- Voltaire
- Sir Francis Bacon
- Dante Alighieri
- The Wright brothers
- Bill Gates
- Gregor Mendel
- Mao Zedong
- Alexander Graham Bell
- William the Conqueror
- Niccolo Machiavelli
- Charles Babbage
- Mary Wollstonecraft
- Mikhail Gorbachev
- Margaret Sanger
- Edward Jenner
- Winston Churchill
- Marie Curie
- Marco Polo
- Ferdinand Magellan
- Elizabeth Stanton
- Elvis Presley
- Joan of Arc
- Immanuel Kant
- Franklin Delano Roosevelt
- Michael Faraday
- Walt Disney
- Jane Austen
- Pablo Picasso
- Werner Heisenberg
- D.W. Griffith
- Vladimir Zworykin
- Benjamin Franklin
- William Harvey
- Pope Gregory VII (the oldest person on the list)
- Harriet Tubman
- Simón Bolívar
- Diana, Princess of Wales (youngest on the list)
- Enrico Fermi
- Gregory Pincus
- The Beatles
- Thomas Hobbes
- Queen Isabella
- Joseph Stalin
- Queen Elizabeth I
- Nelson Mandela
- Niels Bohr
- Peter the Great
- Guglielmo Marconi
- Ronald Reagan
- James Joyce
- Rachel Carson
- J. Robert Oppenheimer
- Susan B. Anthony
- Louis Daguerre
- Steven Spielberg
- Florence Nightingale
- Eleanor Roosevelt
- Patient Zero
- Charlie Chaplin
- Enrico Caruso
- Jonas Salk
- Louis Armstrong
- Vasco da Gama
- Suleiman I
Saturday, September 4, 2010
NASA Photo Archive
A great resource for historical images found on Flickr: NASA on The Common photostream:
 A Delta II rocket.
More images can be found here: NASA Images

---
More images can be found here: NASA Images
---
Monday, August 9, 2010
Average Mathematics Scores by Country 2007
This does not seem so bad to me. Here is the original link.
 Average score is higher than the U.S. average score (p < .05)
 Average score is not measurably different from the U.S. average score (p < .05)
 Average score is lower than the U.S. average score (p < .05)
1 Hong Kong is a Special Administrative Region (SAR) of the People's Republic of China.
2 National Target Population does not include all of the International Target Population defined by the Trends in International Mathematics and Science Study (TIMSS).
3 Nearly satisfied guidelines for sample participation rates only after substitute schools were included.
4 Met guidelines for sample participation rates only after substitute schools were included.
5 National Defined Population covers 90 percent to 95 percent of National Target Population.
6 Kuwait tested the same cohort of students as other countries, but later in 2007, at the beginning of the next school year.
7 National Defined Population covers less than 90 percent of National Target Population (but at least 77 percent).
NOTE: Countries are ordered by 2007 average score. The tests for significance take into account the standard error for the reported difference. Thus, a small difference between the United States and one country may be significant while a large difference between the United States and another country may not be significant. The standard errors of the estimates are shown in tables E-1 and E-2 available at http://nces.ed.gov/pubsearch/pubsinfo.asp?pubid=2009001.
SOURCE: International Association for the Evaluation of Educational Achievement (IEA), Trends in International Mathematics and Science Study (TIMSS), 2007.
Table 1. Average mathematics scores of fourth- and eighth-grade students, by country: 2007
| Grade four | Grade eight | ||
|---|---|---|---|
| Country | Average score | Country | Average score |
| TIMSS scale average | 500 | TIMSS scale average | 500 |
| Hong Kong SAR1 | 607 | Chinese Taipei | 598 |
| Singapore | 599 | Korea, Rep. of | 597 |
| Chinese Taipei | 576 | Singapore | 593 |
| Japan | 568 | Hong Kong SAR1, 4 | 572 |
| Kazakhstan2 | 549 | Japan | 570 |
| Russian Federation | 544 | Hungary | 517 |
| England | 541 | England4 | 513 |
| Latvia2 | 537 | Russian Federation | 512 |
| Netherlands3 | 535 | United States4, 5 | 508 |
| Lithuania2 | 530 | Lithuania2 | 506 |
| United States4, 5 | 529 | Czech Republic | 504 |
| Germany | 525 | Slovenia | 501 |
| Denmark4 | 523 | Armenia | 499 |
| Australia | 516 | Australia | 496 |
| Hungary | 510 | Sweden | 491 |
| Italy | 507 | Malta | 488 |
| Austria | 505 | Scotland4 | 487 |
| Sweden | 503 | Serbia2, 5 | 486 |
| Slovenia | 502 | Italy | 480 |
| Armenia | 500 | Malaysia | 474 |
| Slovak Republic | 496 | Norway | 469 |
| Scotland4 | 494 | Cyprus | 465 |
| New Zealand | 492 | Bulgaria | 464 |
| Czech Republic | 486 | Israel7 | 463 |
| Norway | 473 | Ukraine | 462 |
| Ukraine | 469 | Romania | 461 |
| Georgia2 | 438 | Bosnia and Herzegovina | 456 |
| Iran, Islamic Rep. of | 402 | Lebanon | 449 |
| Algeria | 378 | Thailand | 441 |
| Colombia | 355 | Turkey | 432 |
| Morocco | 341 | Jordan | 427 |
| El Salvador | 330 | Tunisia | 420 |
| Tunisia | 327 | Georgia2 | 410 |
| Kuwait6 | 316 | Iran, Islamic Rep. of | 403 |
| Qatar | 296 | Bahrain | 398 |
| Yemen | 224 | Indonesia | 397 |
| Syrian Arab Republic | 395 | ||
| Egypt | 391 | ||
| Algeria | 387 | ||
| Colombia | 380 | ||
| Oman | 372 | ||
| Palestinian Nat'l Auth. | 367 | ||
| Botswana | 364 | ||
| Kuwait6 | 354 | ||
| El Salvador | 340 | ||
| Saudi Arabia | 329 | ||
| Ghana | 309 | ||
| Qatar | 307 | ||
1 Hong Kong is a Special Administrative Region (SAR) of the People's Republic of China.
2 National Target Population does not include all of the International Target Population defined by the Trends in International Mathematics and Science Study (TIMSS).
3 Nearly satisfied guidelines for sample participation rates only after substitute schools were included.
4 Met guidelines for sample participation rates only after substitute schools were included.
5 National Defined Population covers 90 percent to 95 percent of National Target Population.
6 Kuwait tested the same cohort of students as other countries, but later in 2007, at the beginning of the next school year.
7 National Defined Population covers less than 90 percent of National Target Population (but at least 77 percent).
NOTE: Countries are ordered by 2007 average score. The tests for significance take into account the standard error for the reported difference. Thus, a small difference between the United States and one country may be significant while a large difference between the United States and another country may not be significant. The standard errors of the estimates are shown in tables E-1 and E-2 available at http://nces.ed.gov/pubsearch/pubsinfo.asp?pubid=2009001.
SOURCE: International Association for the Evaluation of Educational Achievement (IEA), Trends in International Mathematics and Science Study (TIMSS), 2007.
Wednesday, July 28, 2010
Thursday, July 15, 2010
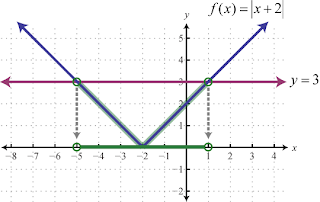
Absolute Value Inequality: A Graphical Approach
An absolute value inequality, such as,

can be solved as follows:

We can visualize these solutions if we graph the function,

in the rectangular coordinate plane and determine where the graph lies below the horizontal line given by . In other words, for what x-values is

This idea is illustrated below:
Furthermore, we could use the same graph to visualize the solutions to,

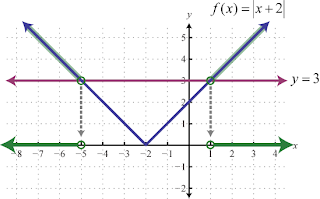
We can see that the solutions are,

Now take the time to compare this visualization to that given on Wolfram Alpha. Remember, it is always helpful to understand the geometric interpretation whenever possible.
can be solved as follows:
We can visualize these solutions if we graph the function,
in the rectangular coordinate plane and determine where the graph lies below the horizontal line given by
This idea is illustrated below:

Furthermore, we could use the same graph to visualize the solutions to,

We can see that the solutions are,
Now take the time to compare this visualization to that given on Wolfram Alpha. Remember, it is always helpful to understand the geometric interpretation whenever possible.
Tuesday, May 18, 2010
Goofram - Search Google and Wolfram Alpha at the same time!
This is an interesting idea... google and Alpha side by side!
Goofram - Search Google and Wolfram Alpha at the same time!
---
Goofram - Search Google and Wolfram Alpha at the same time!
---
Thursday, May 13, 2010
Math Education in the Real World
Here is a nice talk... "students come pre-installed with viruses..."
Thursday, April 8, 2010
The Future of the Lecture?
Here is a link that I found interesting regarding the future of education.
A Parody of the Future of Education
It is worth thinking about.
A Parody of the Future of Education
It is worth thinking about.
Monday, February 15, 2010
CAUTION: Multiplication before addition or subtraction.
Be aware that "they" like to dangle addition or subtraction in front of us like follows:
It is very much tempting to subtract 5 - 2, isn't it? DO NOT DO IT... the order of operations requires that we multiply (or distribute) before subtraction. The solution follows:
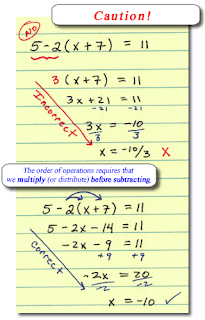
5 - 2(x + 7) = 11
It is very much tempting to subtract 5 - 2, isn't it? DO NOT DO IT... the order of operations requires that we multiply (or distribute) before subtraction. The solution follows:

Screen Capture
Use the Snipping Tool in Windows Vista for quick and easy screen captures. It is included, so to find it click the Start menu and type "snipping" in the search box.
Here is a link to more detailed instructions.
Here is a link to more detailed instructions.
Saturday, February 13, 2010
Solving Linear Equations
Another video posted on YouTube. It seems that YouTube is more mobile friendly than blip. Here is another video test.
Stop Motion Tutorial
This is my first attempt at a stop motion video tutorial. Just a test really. I am solving a linear equation that happens to be an identity.
Thursday, February 11, 2010
Free Fonts
Links to free fonts and how to make them! This might be useful.
http://www.articulate.com/rapid-elearning/over-100-free-handwritten-fonts/
http://www.articulate.com/rapid-elearning/over-100-free-handwritten-fonts/
Wednesday, February 3, 2010
Copyrights Made Easy
The creative commons website offers easy to use tools for determining which attribution is best for you. Visit the site:
http://creativecommons.org/
Click license, and after answering the questions click the Select a License button. It then shows which license is best and provides HTML that can be cut-and-pasted into your website as follows:

This work is licensed under a Creative Commons Attribution-Noncommercial-Share Alike 3.0 United States License.
http://creativecommons.org/
Click license, and after answering the questions click the Select a License button. It then shows which license is best and provides HTML that can be cut-and-pasted into your website as follows:
This work is licensed under a Creative Commons Attribution-Noncommercial-Share Alike 3.0 United States License.
Tuesday, February 2, 2010
Free Digital Textbook Initiative Review Results
The California Learning Resource Network reviewed several free textbooks and compared the content to the current California content standards. Have a look:
Free Digital Textbook Initiative Review Results
Subscribe to:
Posts (Atom)